The 21cm hydrogen line is a spectral line produced by atomic hydrogen. Due to the abundance of hydrogen atoms and the nature of radio waves to penetrate dust clouds in our galaxy, we can study the milky way by observing the doppler-shifted spectral line. Spectra attached below are the result of multiple gaussian curves and the corresponding radial velocity of the individual peaks are then used to construct the structure and rotation curve of the milky way.

Self built 1.4m parabolic dish (geodesic dish developed by JA6XKQ http://www.terra.dti.ne.jp/~takeyasu/...) mounted on an equatorial mount used for astrophotography.

Spectra along the plane of our galaxy from galactic longitude 0 to 360 degrees at latitude 0 degrees. Radial velocities are corrected to the local standard of rest (LSR). Individual spectrum is multiplied by a constant obtained from the calibration using the S7 region's peak brightness temperature value from the LAB survey, at https://www.astro.uni-bonn.de/hisurvey/euhou/LABprofile/

Spectrum with multiple gaussian curve fitted.

Hydrogen line map from declination -60 to 60 degrees. Hydrogen column density is calculated by integrating the area under the spectrum from radial velocity -150km/s to 150km/s and times 1.82x10^18, given at https://www.cv.nrao.edu/~sransom/web/Ch7.html
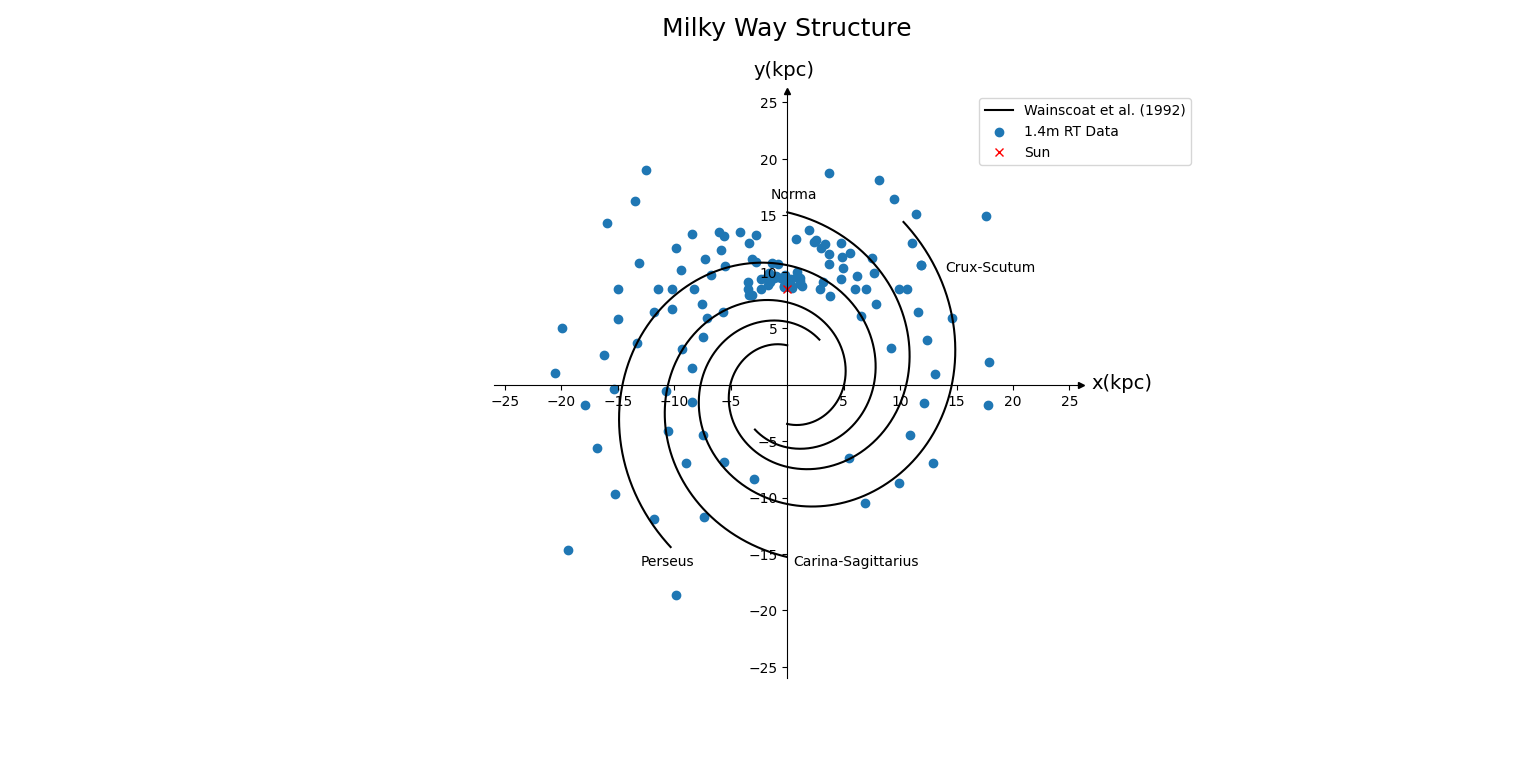
Milky way structure. Data seemed to only match with the Perseus and Carina-Sagittarius arms. Most of the points are in between the Perseus and Norma arm, this is probably due to unresolved peaks in the spectrum from smaller radio telescope. Parameters for the spirals arm plot can be found on page 7 at https://iopscience.iop.org/article/10.1086/501516/pdf

Lastly the rotation curve fitted with a logarithmic curve. The rotation speed is obtained by choosing the most red-shifted and blue-shifted radial velocities in the spectra obtained from Quadrant I and IV respectively. The rotation speed are lower compared to the published data from Clemens (1985) attached, because the most red and blue-shifted peaks are often weak and difficult to detect with good SNR and hence the chosen peaks will be not be the maximum and minimum radial velocities. But the general trend can be seen clearly in the graph, a flat curve as you go further away from the center of milky way, suggesting that something is giving them extra speed and most of the mass might not be concentrated in the center.
.png)
Rotation speed against radius figure from Clemens (1985), Ap. J. 295, 422.
Shout out to Society of Amateur Radio Astronomers (SARA) for funding this project!
Shout out to Society of Amateur Radio Astronomers (SARA) for funding this project!
No comments:
Post a Comment